Data Visualizations
Identifying and proposing solutions to pain points in web archiving workflows.
User research, workflow mapping

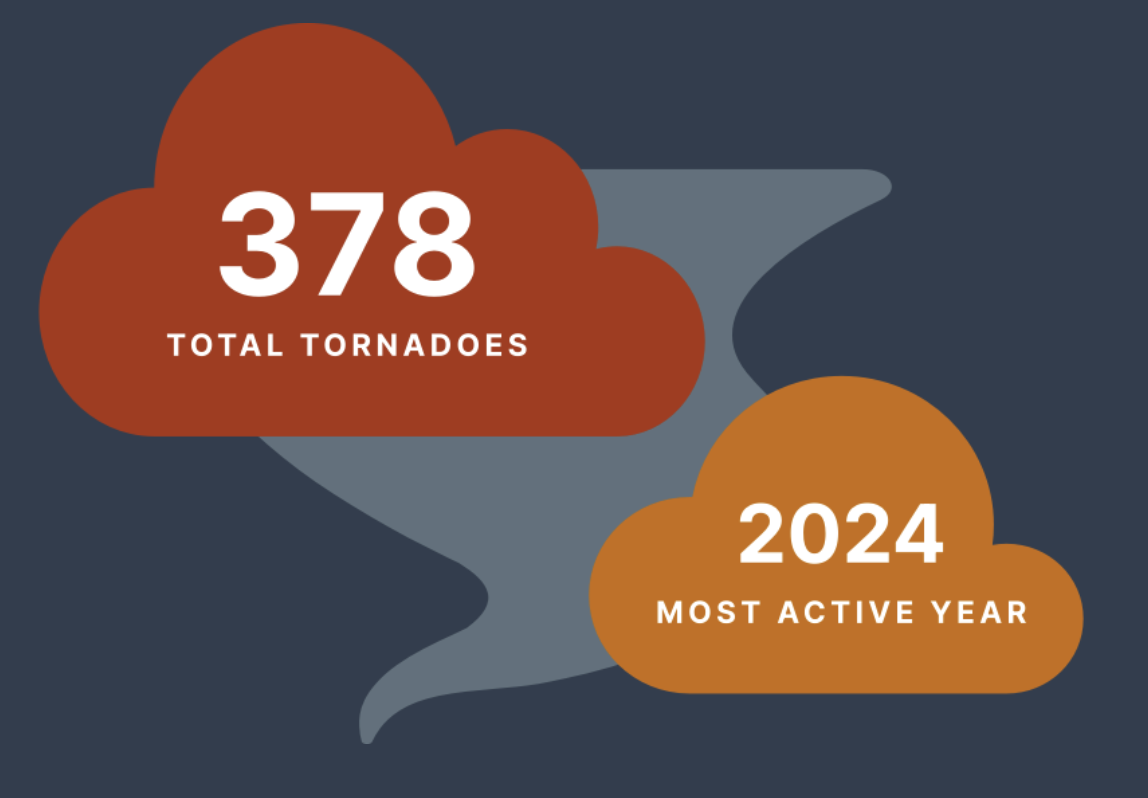
This dashboard pulls together confirmed tornado data for the Chicagoland region from 2001 to 2024. It provides a year-by-year and spatial view of tornado frequency and patterns across the metropolitan area, helping to illustrate how storm activity has changed over time and where tornadoes tend to touch down.